
The Calm Before the Storm?
In this business, you seem to find three distinct groups of people. The first are what we’ll call the perma-bulls. For this group, the sun is always shining and they downplay even the slightest hint of a cloud on the horizon.
The next group are what we’ll call the perma-bears. This group is the exact opposite of the first group. For them, disaster is always just around the corner. Sunny skies? That is simply an illusion to lull you into complacency.
Finally, there is the group in the middle. This group understands that the skies generally tend to be clear but every now and then a storm will come along. Most of the storms tend to be inconsequential, but every now and then there is one that causes some real damage. Count us squarely in this group.
Things have been great in the economy and the markets thus far in 2021. Not to bring politics into the discussion, but economic activity in the “red” states started off 2021 a bit more robust due to looser Covid restrictions. However, the “blue” states have excelled at getting people vaccinated and their economies are really starting to take off. Put it all together and people are feeling good – confidence is high.
Of course, things might be a little too good. For example, housing prices are up some 20% year-over-year – a big win for homeowners – and housing sales around the nation are being characterized by bidding wars, a win for our real estate agent clients. For the first time in memory, people are also paying over sticker price for new cars. The fact that there is so much demand is great. The fact that this demand is resulting in abnormal purchasing behavior is not so great.
The question on our minds at this moment is whether things are a bit too calm. Before we tackle that question, let’s briefly review the quarter.
2Q 2021 Review
The following chart reflects the performance of a variety of indexes during the last quarter and for longer periods as well.
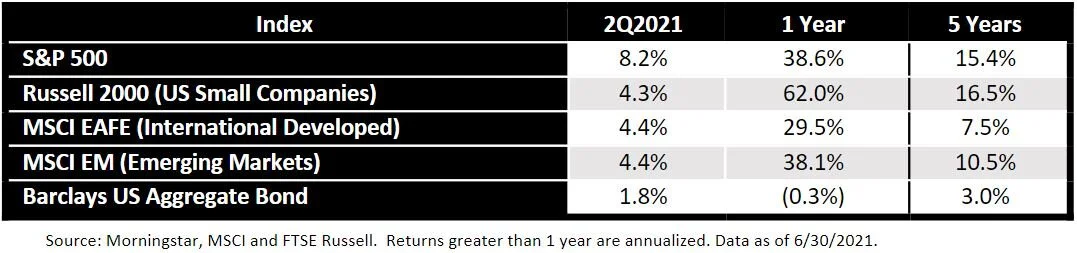
The S&P 500 was the clear winner of the quarter nearly doubling the performance of the other stock market indexes we follow. Interestingly, the other indexes all had nearly identical performance for the quarter. Bonds provided a solid return for the quarter as interest rates moderated a bit following a big move up earlier in the year.
The longer-term results continue to be impressive for the various stock indexes (although developed international stocks are lagging a bit). Of course, we have experienced an amazing rebound from the March 2020 Covid lows, so the most recent 1-year returns make everything look pretty good.
As we have previously counseled, one has to be careful about putting too much stock into past returns since they can change pretty dramatically over time. To that end, the following chart shows the above 1 year and 5 year returns as of June 30, 2020 (1 year ago).
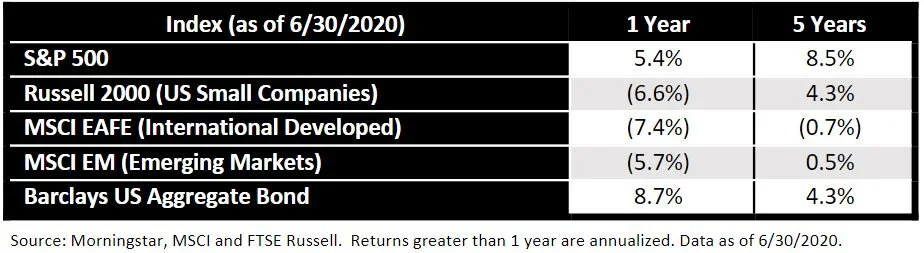
Note, among other things, how the 5-year return in the Emerging Markets went from just 0.5% per year as of June 30, 2020 to 10.5% per year as of June 30, 2021. Again, be very careful when you try to assess past performance. The numbers can change very quickly and can be a bit deceiving. It is important not only to understand the longer-term numbers but to examine the underlying data to determine whether things look good (or bad) simply due to an extreme result in one of the sub-periods. Of course, that’s what we are here for.
Are Things Too Calm?
From a market perspective, things have been about as good as they can get. When you see a 5-year return for the S&P 500 that is some 50-100% over the norm (depending on the entry point, 8-9% would be a more realistic expectation), you need to start thinking about what might result in a return to the mean (i.e., a downward move).
To compound matters, since the big downward move last March due to Covid (which recovered very quickly), there have not been many down periods. In fact, any down moves have been limited to single digits. As the following chart (courtesy of First Trust) reflects, the average down move each year is between 13 and 14%. There have clearly been years with smaller “peak to trough” moves, but there tends to be a catch-up at some point that does not feel too good.

While we do not foresee anything horrendous on the horizon, there are a few things that might result in some weakness. Three that are among the most apparent:
Inflation – We have beaten this issue to death over the course of the last few months, so we won’t spend too much time on it. The Fed claims that inflationary pressure will be transitory. There are many market participants that disagree. If inflation gets out of control – or if the market perceives it is getting out of control – things can get a bit rocky for a period until the dust settles. Again, companies can navigate changes in costs, so they tend to be fine over time, but there is a bit of an adjustment period that can be uncomfortable.
Covid – We know you are sick of hearing about Covid, but new variants continue to develop. There has been some talk about a new round of lockdowns in certain states. If that were to occur, it could result in some market weakness.
International Issues – China continues to flex its muscles as it is seeking to become the premiere economic and military power in the world. Iran has elected a new president who has been described by many outlets as a hardliner with a history of being personally involved with/responsible for grave human rights violations. Russia appears to be getting more aggressive in the Black Sea. And the list goes on…It may be that none of these turns into anything more significant than a headline. However, the risk of an international conflict that can result in a significant market move remains high (as it has for years).
As if those aren’t enough, there is always that unknown Black Swan. Personally, we love it when people explain that this event or that might be the next Black Swan event. Definitionally, a Black Swan event is one that arises from left field – it is random and largely unknowable ahead of time. Covid is a great example. On the other hand, the 2008-2009 housing crisis was foreseen by many. While the damage caused was not anticipated, the precipitating events really were not a huge surprise.

Our Positioning
As we have discussed, for most clients our portfolios are effectively split into two components – a long-term “buy and hold” portfolio, which represents about 50% of the total portfolio and a more opportunistic “trading” portfolio, representing the other 50%.
There are two things that make our approach a bit unique. First, for those concerned about the market or those in retirement and/or unable to withstand significant down moves, our long-term “buy and hold” portfolio can utilize investments that provide a measure of automatic downside protection – our “hedged” portfolio. In other words, these investments can potentially protect the value of the account during difficult times in the market (although, the downside protection may come at the cost of upside participation).
Tax deferred accounts invested in our hedged portfolio may have seen quite a bit of change at the end of the quarter. Due to the strong markets to start the year, we felt it would be prudent to lock in some of the gains and reset our downside protection. Based on the changes, the positions will largely provide a measure of protection from the current market levels (as opposed having to get back to the levels at the beginning of the year before the protection kicks in). Additionally, the upside caps have been reset higher. So, the changes provide better downside protection and better upside participation given where we are at the moment.
The second thing that makes us unique is our use of both passive and opportunistic approaches. For the opportunistic portion of the portfolio, we work closely with an institutional investment management firm to ensure that we – and by extension you – have access to the same data and insights relied upon by many of the top investment management firms around the world. This is a data-driven process – we do not let our personal feelings about the market contradict the data. We rely on 6 primary indicators that help derive our top-down decision on how much to allocate to stocks vs. bonds:
Relative Strength: measures whether stocks or bonds are more attractive
Market Breadth: looks at whether many or just a few stocks are improving
OECD Leading Indicator: identifies turning points in business cycles
PMI Breadth: focuses on whether manufacturing activity is expanding or contracting
Baltic Exchange Dry Index: studies shipping rates
Central Bank Policy: examines the activity of central banks around the world with respect to rates and other monetary policy.
Based on the indicators, our opportunistic portfolio began overweighting stocks relative to bonds and established a larger position in smaller company stocks in late 2020, which proved prescient. We have remained overweight stocks relative to bonds all year. As we enter the third quarter, we are maintaining an overweight to stocks; although our bond exposure is increasing a bit. On the stock side of the portfolio, there is a bit of a tilt towards growth-oriented companies and U.S. companies in general. This part of the portfolio tends to trade more frequently, so changes may be made in the upcoming months as the overall tone of the market continues to change.
Closing
As the summer really kicks into full steam (steam seems appropriate to describe Florida right now), we hope that you take some time to enjoy your families and friends. With luck, many of you will have a chance to take a trip or two. Either way, I think the last year has helped many of us appreciate what’s important in life. Hopefully, we’ll remember that lesson going forward and expend our energies accordingly.
Have a wonderful summer!