
Monte Carlo
Last month we touched on how simply using an average return is a poor way to forecast. We then provided a couple examples showing a simple retirement forecast and how the sequence of the returns can make a significant difference in the outcomes even when the average return is the same.
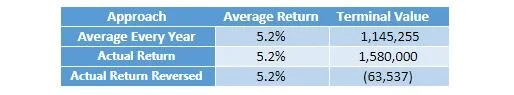
As a reminder, here’s how different the outcomes were for a 65-year-old retiree taking $50,000 from a $1 million retirement nest egg:
This chart only represents three scenarios, but there are clearly many other iterations. In order to provide as robust an analysis as possible when we are preparing long-term forecasts, we perform a Monte Carlo analysis on your portfolio. The Monte Carlo analysis looks at 1,000 potential portfolio return scenarios to determine whether or not the odds are in your favor to have a “successful outcome”, which is defined as achieving all of your financial goals without running out of money.
To make the presentation of the outcome easier to interpret, we use a simple “speedometer”:
In essence, if your plan lands in the purple area, your goals may be a bit too aggressive given your resources. “Aggressive” may mean that you are trying to retire too early, spend too much, or something else.
On the other hand, if your plan lands in the blue area, it suggests that either you are being too conservative or that you simply have more resources than you will need to live the life you want to live.
For most people, the goal is to hit the green section. However, regardless of where you land, you need to remember that we are dealing in probabilities, so there is no “sure thing”. To that end, here are the potential outcomes for two clients. The first started off in the dreaded purple zone. The second ended up in the blue zone.
Let’s start with a quick look at our “purple” client. The goal was to retire in 2026/2027:
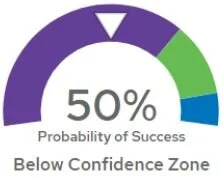
Clearly, having a 50% probability of success is not ideal. Half of the time, you will end up successful, the other half, you run out of money. The interesting thing, though is to look at the range of potential outcomes:
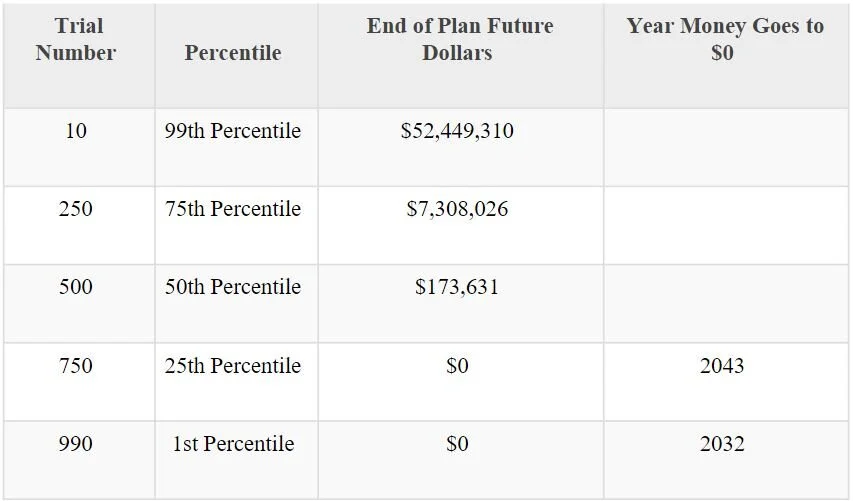
Think about that, if things go wonderfully and there are no changes in spending, the portfolio could swell to over $52 million! However, if things do not go so well, money runs out a mere 5-6 years into retirement. Remember, for this client, in about 50% of the scenarios, money runs out too quickly.
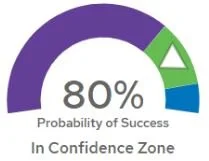
Now, let’s contrast that with our blue client, which just so happens to be our purple client pushing back retirement a few years. As such, the spending goals remain the same, but retirement is being delayed until 2033 (for anyone wondering, the client is still younger than 65 at this point):
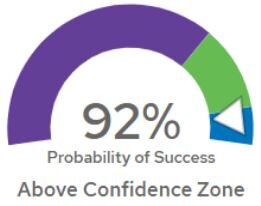
This is a result that can inspire some real confidence, right? In this scenario, there appears to be a shortfall in only 8% of the scenarios. Again, let’s look at the range of potential outcomes:
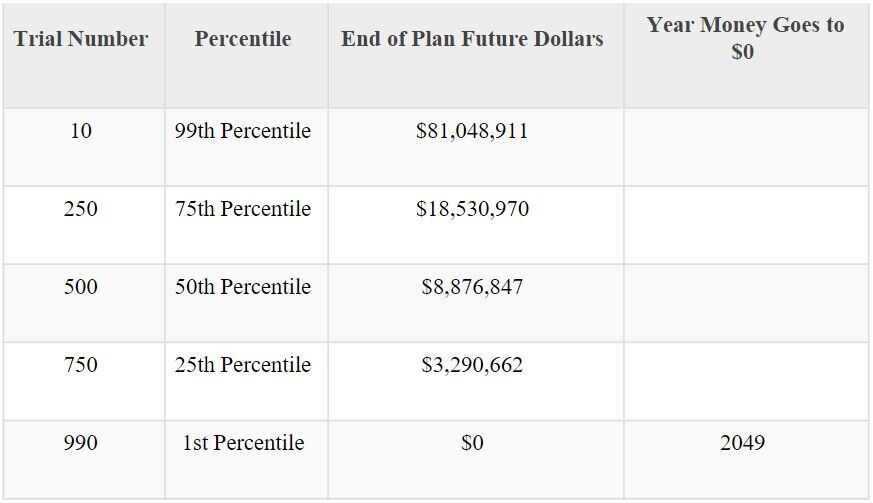
In this case, if things go very well, the portfolio grows to over $80 million! However, even in this case, there is a chance of running out of money. The odds are slim, but they are not zero.
What you may notice is that in both cases, if things work out well, the portfolio grows tremendously (for reference, the starting point today is around $1.5 million). However, in both cases, there is also the risk of running out of money too early.
Of course, either scenario is sub-optimal. While there are some exceptions, very few people want to die with a portfolio worth $80 million (or $20 million, for that matter). Those people could have spent more while alive – on family, gifts to charities, experiences, etc. – and potentially enriched their lives. Similarly, we are not aware of anyone that wants to run out of money prematurely, particularly when potentially modest adjustments could have prevented that outcome.
So, how do we address these disparate outcomes?
We try to start with a plan that is realistic and neither too conservative nor too aggressive. In other words, we shoot for the green zone for most clients. Again, there are some clients for whom the blue zone is fine because they simply have more than enough resources, but for most clients, the blue zone tends to result in a potential unnecessary compromise of lifestyle.
We do regular checkups. Given the extreme variance in potential outcomes, it is not enough to simply assume that things will go well. It isn’t only the performance of the portfolio that can result in changes, there are also countless unexpected events that can have an impact: health issues, an unanticipated windfall/loss, family additions/losses, etc. Regular checkups allow us the opportunity to make subtle course corrections along the way to keep things on track rather than being forced to make dramatic changes at some point in the future after things have drifted too far one way or the other. Face it, it is a lot easier to go from spending say $100,000/year to either $99,500 or $100,500 than it is to go from $100,000 to $60,000 or $140,000!
The goal is to put the odds on your side and to keep them there. Some of us are natural optimists while others are natural pessimists, so our attention tends to gravitate to the extremes. However, focusing on a small subset of potential outcomes is neither logical nor healthy. Our job is to keep you centered so you can focus on what is truly important – living life your way with those that matter the most.
Have a wonderful month!