
The Other Foot
Last quarter, we spent quite a bit of time discussing what amounted to one of the worst quarters in market history. This quarter, the shoe was on the other foot.
During the quarter, the economy began to thaw from its forced freeze as a handful of states started to relax stay-at-home restrictions and businesses reopened in phases. As a result, unemployment claims dropped, consumer confidence picked up, and the markets experienced a tremendous surge.
You may recall that last quarter, we tried to temper the bad news by highlighting some of the good things that were happening. This quarter, we’d like to offer a couple observations to temper the somewhat rabid enthusiasm in the markets:
Day trading has come in vogue in a way that is reminiscent of the dot.com bubble. Back then, lawyers and other professionals were leaving their jobs because they were making more money day trading tech stocks. Today, it is largely the gaming Millennial and Gen Z crowds (along with some in other generations who need an outlet for their gambling pastime). Back in the dot.com days, the day traders all had to go back to their day jobs when Mr. Market taught them a valuable lesson – easy come, easier go. We doubt that things will be different this time around.
The market is currently hinging its hopes on the development of a vaccine, the full reopening of the economy, a return to normalcy, earnings in 2022 high enough to justify current prices, and the Fed.
At this point, a vaccine may be forthcoming, but it still looks like a mid-2021 event (or later), particularly when you think about the massive amounts of vaccine that will ultimately need to be produced.
Recent surges in Covid cases suggest a full reopening and a return to normalcy may be delayed. Currently, some states are scaling back on reopenings rather than moving full steam ahead.
The longer the delay in reopening, the more difficult it will be to justify current valuations without looking even farther into the future. To that point, justifying current valuations based on assumed 2022 earnings seems like a poor rationalization, particularly since analysts have difficulty forecasting returns a quarter or two in the future.
The Fed is doing its job – that’s the real bright spot for markets.
Market participants seemed to be overjoyed by last month’s 13.3% unemployment rate and the more recent 11.1% rate. While both represent a dramatic improvement from where we were, the rate still exceeds 10%! Given the damage that has been done – and continues to be done – it may take quite some time to get back to sub-4% rates, if ever. In the meantime, reduced government support may begin to take a toll on those who are unemployed, decreasing consumer demand and providing a headwind to the recovery.
Notwithstanding all of this, there is an old market adage – do not fight the Fed. And the Fed is certainly doing what it can to provide support to the economy and the markets.
2Q 2020 Review
The following chart reflects the performance of a variety of indexes during the last quarter and for longer periods as well.
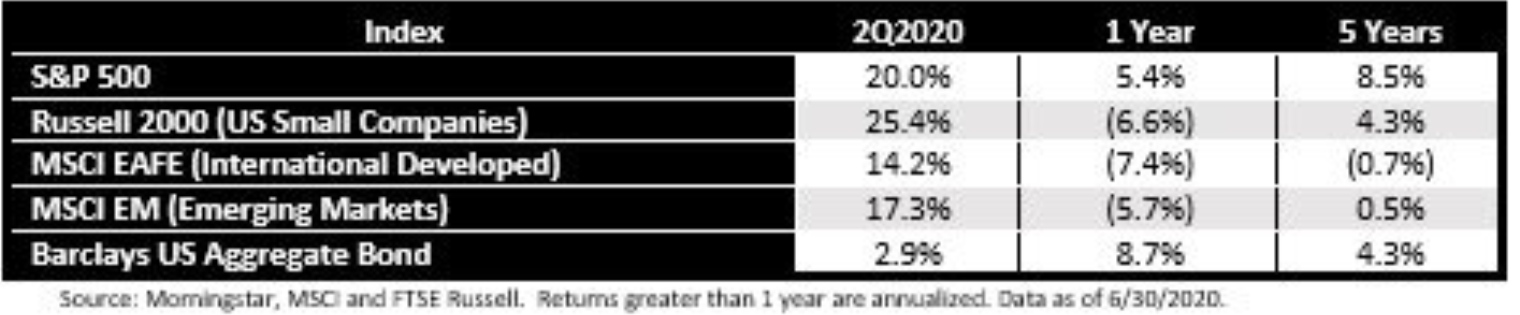
During the quarter, small company stocks led the way. However, any stock investment would probably have made you smile. Unfortunately, other than the S&P 500, the other stock indexes are still reflecting losses for the trailing 1-year period. Surprisingly, international developed stocks have posted losses for the last 5 years as well.
Historically, the long-term returns of US stocks and international stocks have tended to reflect a greater degree of parity. The dispersion we are currently seeing has largely persisted since the end of the Great Recession. The question going forward is whether that trend will persist or whether we will begin to see a reversion to the mean, which would suggest outperformance by non-US stocks for an extended period of time. Time will tell.
The volatility from quarter to quarter has been a topic we have talked about quite a bit. However, the following chart really puts things into perspective:

Simply put, the returns for the various stock indexes are the very definition of volatility. The stock returns in the 4th quarter of 2019 and the 2nd quarter of 2020 would have been wonderful returns for an entire year. The first quarter of 2020 was the exact opposite. To think that this chart only represents the last three quarters is absolutely remarkable.
What Does the Future Hold?
As you might imagine, we spend a lot of time and effort staying on top of the markets and digesting the research and opinions of a variety of strategists and other prognosticators. For the record – we do not rely on any of them; they are human and are as infallible as the rest of us. However, having perspective and benefitting from the wisdom – and experience – of others is important.
Typically, there is some degree of consensus among the strategists we follow. While they may not agree on magnitude, they typically agree on direction. That has not been the case for much of this year; however, that is beginning to change. Most are coalescing around the idea that most of the weakness is behind us unless we get another economic lockdown.
Yet, despite this general agreement, the outlooks are varied, with some expecting tremendous increases and others being a bit more sedate in their expectations. Of course, things can change quickly as new information becomes available. With election season beginning to shift into high gear, expect a lot of new information to sway the markets.
Our Positioning
As we have discussed, our portfolios are effectively split into two components – a long-term “buy and hold” portfolio, which represents about 50% of the total portfolio and a more opportunistic “trading” portfolio, representing the other 50%.
At most, we only do trades in the opportunistic portfolio on a monthly basis – there are some months that no trades are done. This is a data-driven process – we do not let our personal feelings about the market contradict the data. We rely on 6 primary indicators that help derive our top-down decision on how much to allocate to stocks vs. bonds. This month, three of the indicators changed to favor stocks for the first time in months. With two other indicators already favoring stocks, we now have five of the six favoring stocks. To that end, our stock exposure was increased this month.
Closing
Until the end of 2019, the markets were relatively “boring”. Clearly, that has changed with the swings over the last three quarters providing a true lesson in the meaning of volatility. As the saying goes, this too shall pass. Of course, we may need to wait until the election before we can make any reasonable assumptions about the economy and the markets given the disparate policies of the candidates. In the interim, we are here if you have any questions or concerns. Enjoy the summer!